Tracking usage in Webflow Cloud
The Webflow Cloud dashboard lets you monitor your app’s resource usage each month so you can optimize performance and avoid exceeding your plan’s limits. Regularly reviewing these metrics helps you prevent service interruptions and plan for growth. For details on usage limits and available resources, see the pricing and limits pages.
Metrics
Requests
Counts each incoming HTTP or API request that runs your app’s code. Every time a user or client sends a request to an endpoint handled by your app, it counts as one request.
- Each page load, API call, or repeated request increments the count.
- Only requests that execute your app’s code are counted.
- Subrequests, requests your app makes to other services, don’t count toward this total.
Example 10 users each load a page that runs your app: 10 requests. If your app fetches data from another API during execution, those subrequests aren’t included in the request count.
CPU time
Measures the total time your app’s code actively runs on the server’s CPU during each request. Only periods when your code is executing, such as parsing, processing, or calculations, are counted.
- Time spent waiting for external resources (like network requests or timers) isn’t included.
- Only active code execution is counted; idle or waiting periods are excluded.
Example Your app processes data for 2 ms, waits 100 ms for an API response, then processes for another 3 ms. Total CPU time: 5 ms (not 105 ms).
Bandwidth
Bandwidth for your Webflow Cloud app is counted together with your site’s overall bandwidth. Any bandwidth your app uses will show up in your site’s bandwidth metrics, which you can view in the Site Usage tab under Webflow Site Settings > Usage. For more details, see the Bandwidth overview.
Optimizing bandwidth usage
To get the best performance and keep bandwidth usage in check, make sure your app serves assets (like images, videos, and files) directly from your app, rather than proxying assets from your site. This helps reduce unnecessary data transfer and ensures your assets are delivered quickly and reliably. See more details in our optimization tips for Webflow Cloud.
Memory
How to view your usage
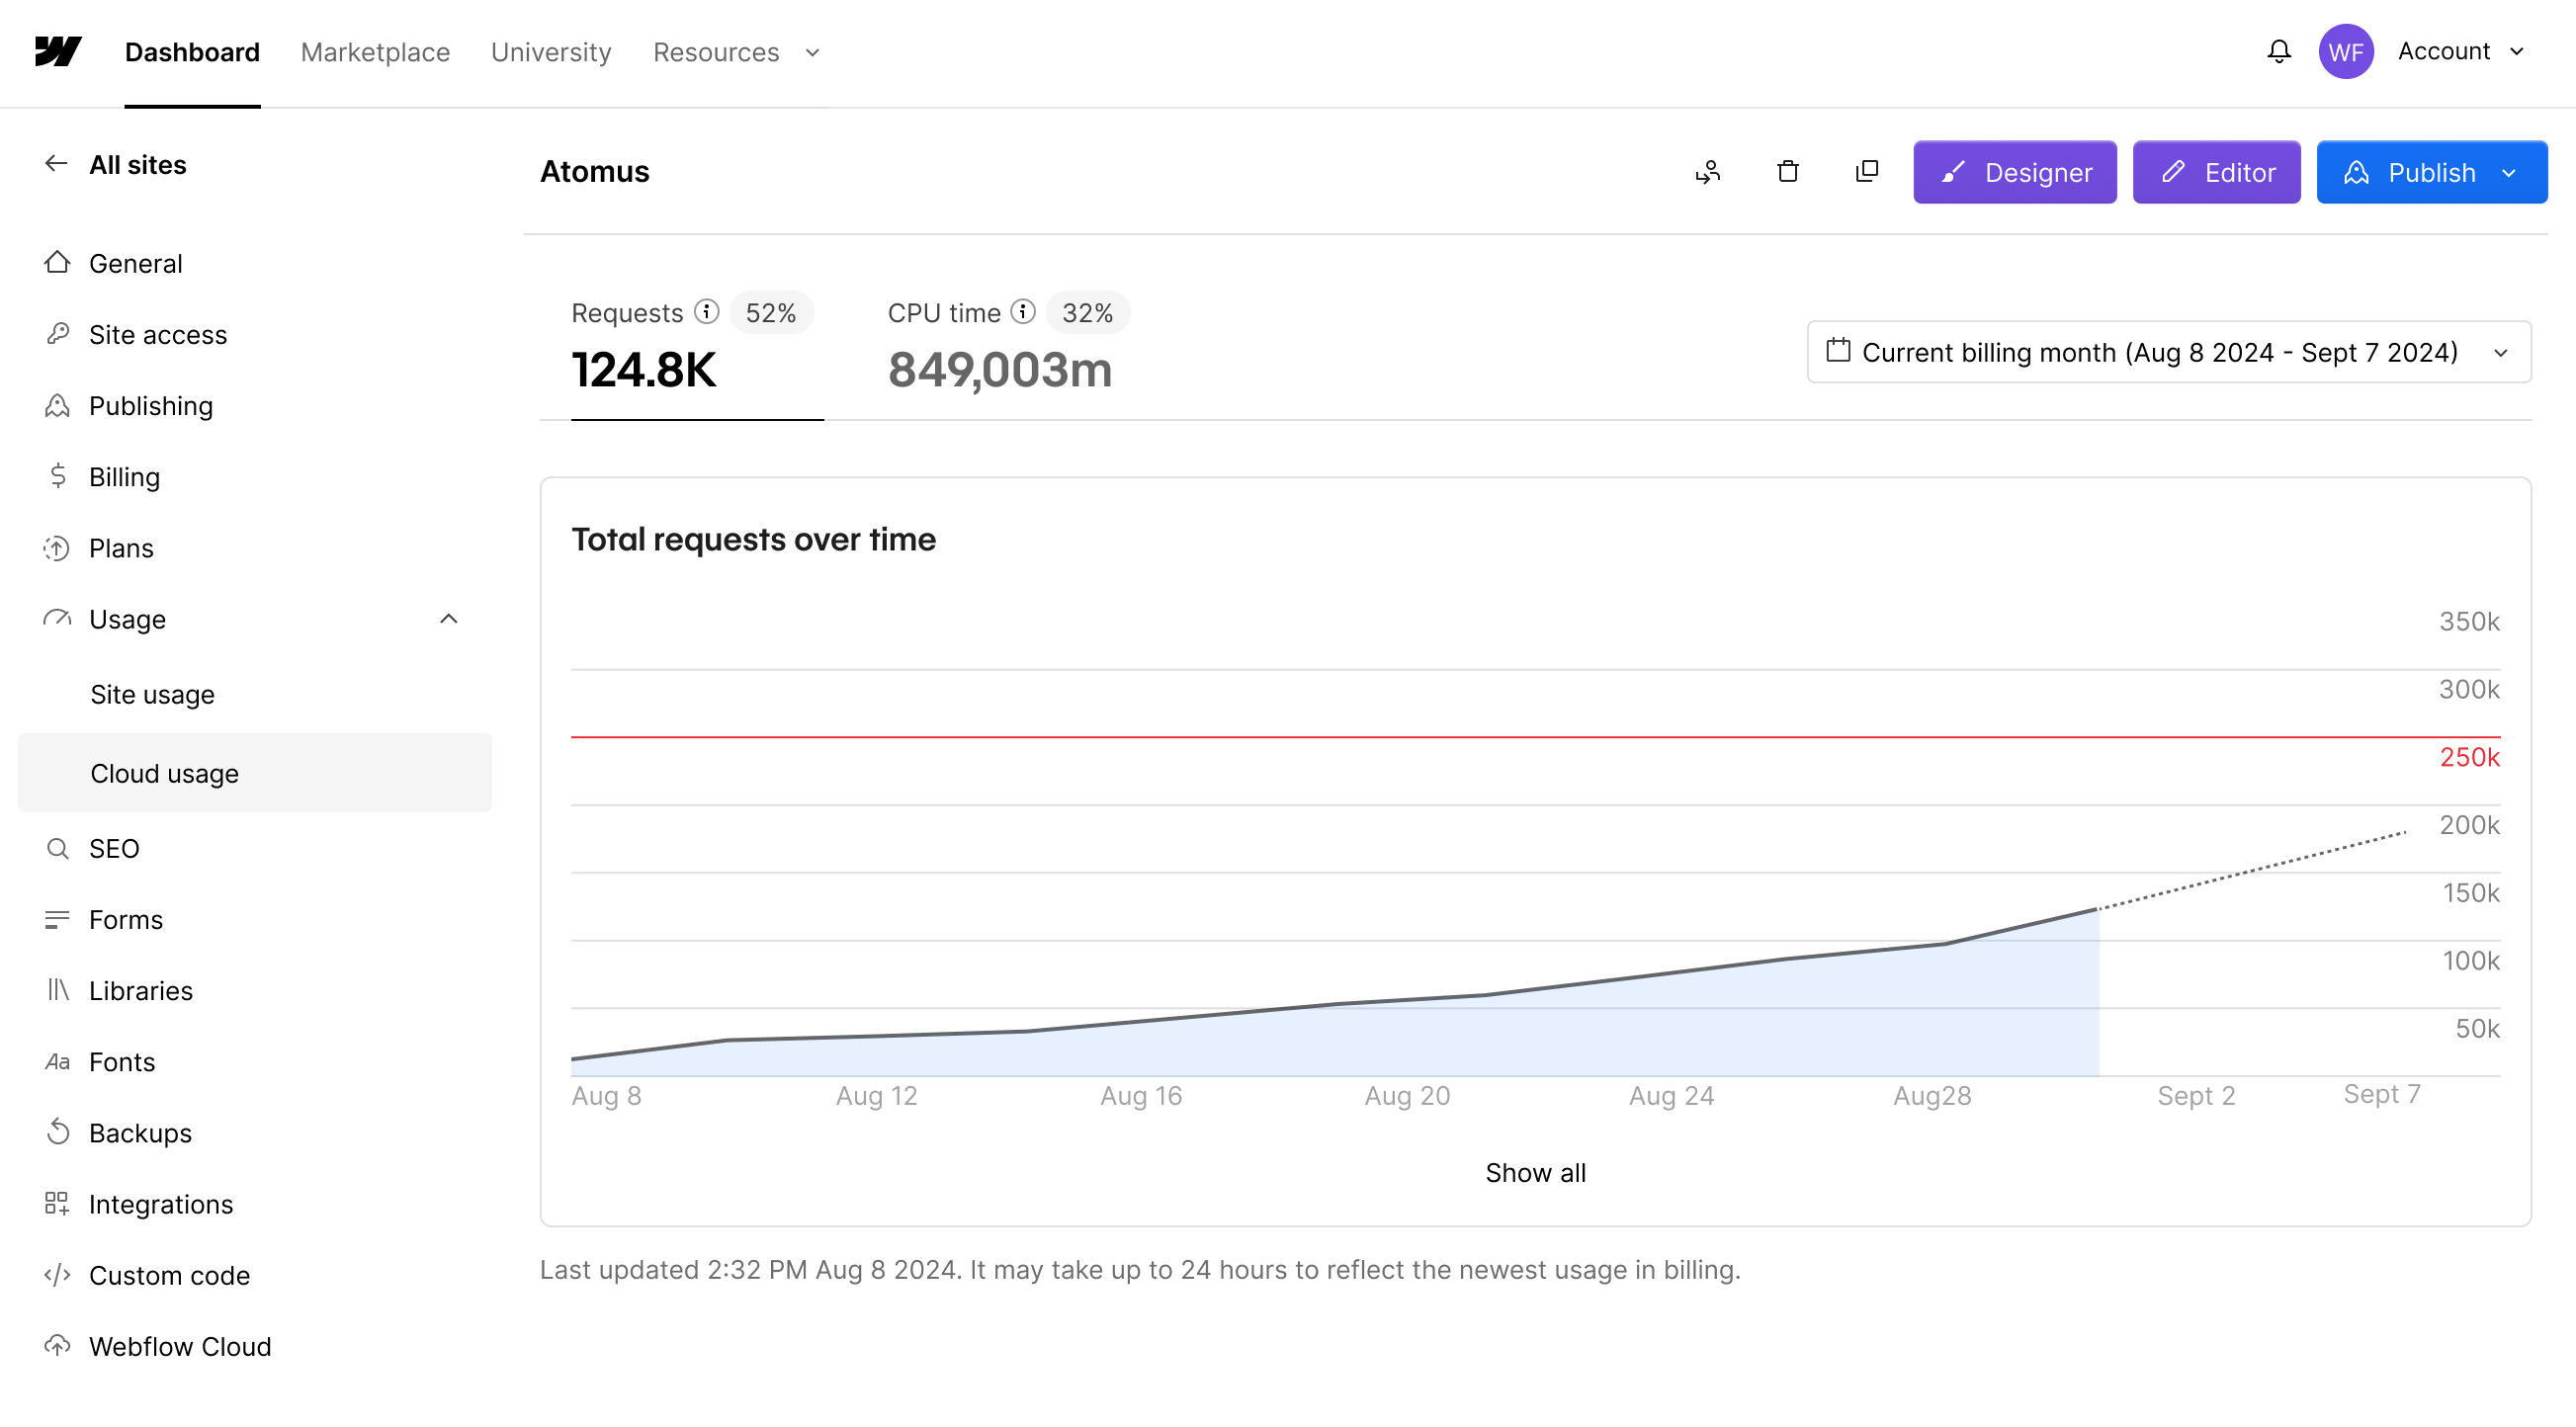
Usage metrics reset at the start of each billing period. In the Webflow Cloud dashboard, you can view your current request and CPU time usage, and see how close you are to your plan’s limits.
Best practices for monitoring usage
- Check usage regularly: Review your dashboard at least once per billing cycle.
- Monitor trends: Use the dashboard’s charts to spot spikes or unusual patterns.
- Understand your limits: Refer to the pricing and limits page for details on your plan’s included resources.